Cox Regression
The Cox proportional hazard regression model can analyze the impact of multiple factors on survival time, and allows for the presence of truncated data. It is the most important multivariate analysis method in survival analysis. Its regression model is similar to linear regression, but the difference is that Cox regression is the logarithm of the ratio of individual risk to population baseline risk, and uses a method based on the order of events to establish the maximum likelihood function.
Data description:
Background description:
In this study, Cox regression analysis was used to investigate the impact of some variables on the time of event occurrence. Cox regression is a commonly used survival analysis method used to analyze and predict the timing of events such as death, disease progression, etc. In this case, we focus on two variables A1 and A2, which may have an impact on the timing of the event. These variables can be any factor related to the occurrence of the event, such as the patient's age, gender, treatment method, etc.
By conducting Cox regression analysis, we can evaluate the impact of each variable on the time of event occurrence and determine whether they are statistically significant. The regression coefficient represents the direction and intensity of the variable's impact on the time of event occurrence. The standard deviation and Wald value are used to evaluate the significance of the regression coefficient, while the p-value represents the level of significance. In addition, HR values can help us explain the ratio impact of variables on the risk of event occurrence.
By analyzing these results, we can conclude which variables have a significant impact on the time of event occurrence and which variables have no significant impact. This is very important for understanding the relevant factors of the event occurrence and providing a basis for further research and decision-making.
Cox regression analysis is an important statistical method that can help us understand the influencing factors of event occurrence time and provide scientific basis for prediction and intervention.
In this case, we evaluated the impact of variables A1 and A2 by analyzing regression coefficients, standard deviations, Wald values, p-values, and HR values, and provided corresponding explanations and conclusions.
The analysis results are as follows:
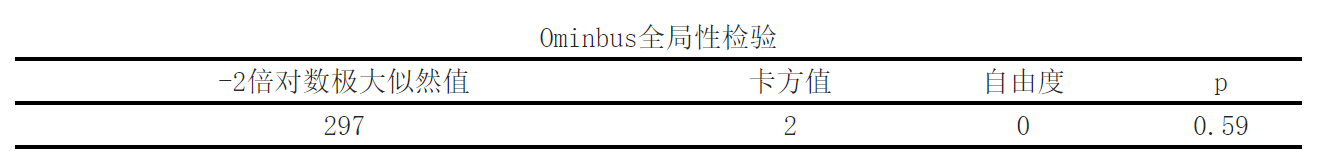
The results show that the significance P-value of the Ominbus global test is 1.0>0.05, which does not show significance at the level and cannot reject the original hypothesis. Therefore, the risk ratios of all variables in the data are zero, and the model is invalid.
Firstly, an Omnibus global test was conducted to test the overall fitness of the regression model. Here, we see that the chi square value is 2, the degree of freedom is 0, and the p-value is 0.59. Based on the commonly used significance level (usually 0.05), we can consider this model to be statistically appropriate, that is, without significant overall fitness issues.
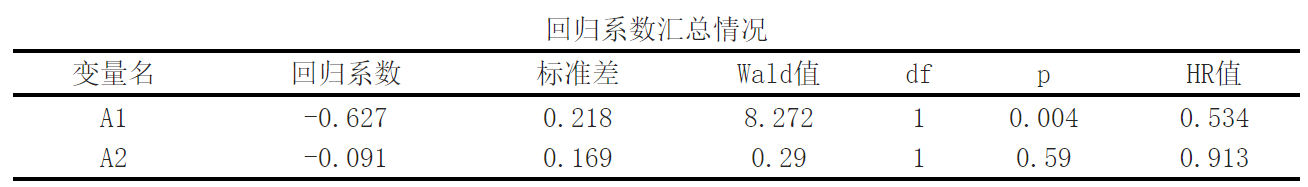
Next, a summary of the regression coefficients for each variable is provided. The regression coefficient reflects the degree to which variables have an impact on the time of event occurrence. Here, there are two variables A1 and A2, with regression coefficients of -0.627 and -0.091, respectively. The positive and negative coefficients of the regression coefficient indicate the direction of the variable's impact on the time of event occurrence, while the magnitude of the numerical value indicates the intensity of the impact.
In addition, the standard deviation, Wald value, degree of freedom, and p-value of the regression coefficients were also given. The standard deviation represents the accuracy of the regression coefficient estimation, the Wald value is used to calculate the significance of the regression coefficient, the degree of freedom indicates the degree of freedom of the model (usually equal to the number of variables), and the p-value represents the significance of the regression coefficient. Here, it can be seen that the regression coefficient of variable A1 is statistically significant (p-value 0.004), while the regression coefficient of variable A2 is not statistically significant (p-value 0.59).
Finally, the HR value (Hazard Ratio) is also provided, which represents the risk ratio of event occurrence. Here, the HR value of variable A1 is 0.534, indicating that increasing the value of variable A1 per unit reduces the risk of event occurrence by 46.6% (1-0.534), while the HR value of variable A2 is 0.913, indicating that increasing the value of variable A2 per unit reduces the risk of event occurrence by 8.7% (1-0.913).
In summary, this Cox regression analysis investigated the impact of variables A1 and A2 on the time of event occurrence. By analyzing regression coefficients, standard deviations, Wald values, p-values, and HR values, we can evaluate the direction, intensity, and significance of each variable's influence. Among them, variable A1 has a significant statistical impact on the time of event occurrence, while variable A2 has no significant impact. These results can help researchers understand the relevant factors of event occurrence and provide a basis for further analysis and decision-making.
Reference:
[1] 朱凯莉,黄燕萍,刘丽,王宁,王锦.基于Cox回归分析的儿童过敏性紫癜复发危险因素研究[J].西安交通大学学报:医学版,2023,44(2):283-287
[2]郭军霞,张永春,刘辉,范振平,龙敬宁,蒲大伟,王建铭.地高辛治疗冠状动脉粥样硬化性心脏病伴房颤患者全因死亡Cox回归分析[J].安徽医学,2022,43(6):647-651
[3]李莹,陈志红,周北凡,李义和,武阳丰,刘小清,赵连成,麦劲壮,杨军,石美玲,田秀珍,关渭全,于学海,陈磊.血脂和脂蛋白水平对我国中年人群缺血性心血管病事件的预测作用[J].中华心血管病杂志,2004,32(7):643-647
[4] 姚婷婷,刘媛媛,李长平,胡良平.生存资料回归模型分析——生存资料 Cox 比例风险回归模型分析[J].四川精神卫生,2020,33(01):27-32.
关注微信公众号发送【示例数据】获取SPSSMAX练习示例数据。
