Hierarchical Clustering
Hierarchical clustering creates a hierarchical nested clustering tree by calculating the similarity between data points of different categories. The advantage of hierarchical clustering is that it does not require specifying a specific number of categories. Instead, it obtains a tree. After clustering is completed, it can be cut across any level to obtain a specified number of clusters.
A total of 81 samples were systematically clustered for variables A1, A2, A3, A4, and A5. The cluster analysis was conducted using inter group linkage clustering method, using Euclidean distance as the interval to generate a cluster lineage diagram.
Data description:
Background description:
In this analysis, we used hierarchical clustering analysis to obtain a lineage diagram that displays the similarities and differences between data samples. The following is a detailed explanation of the lineage diagram:
The lineage diagram is as follows:
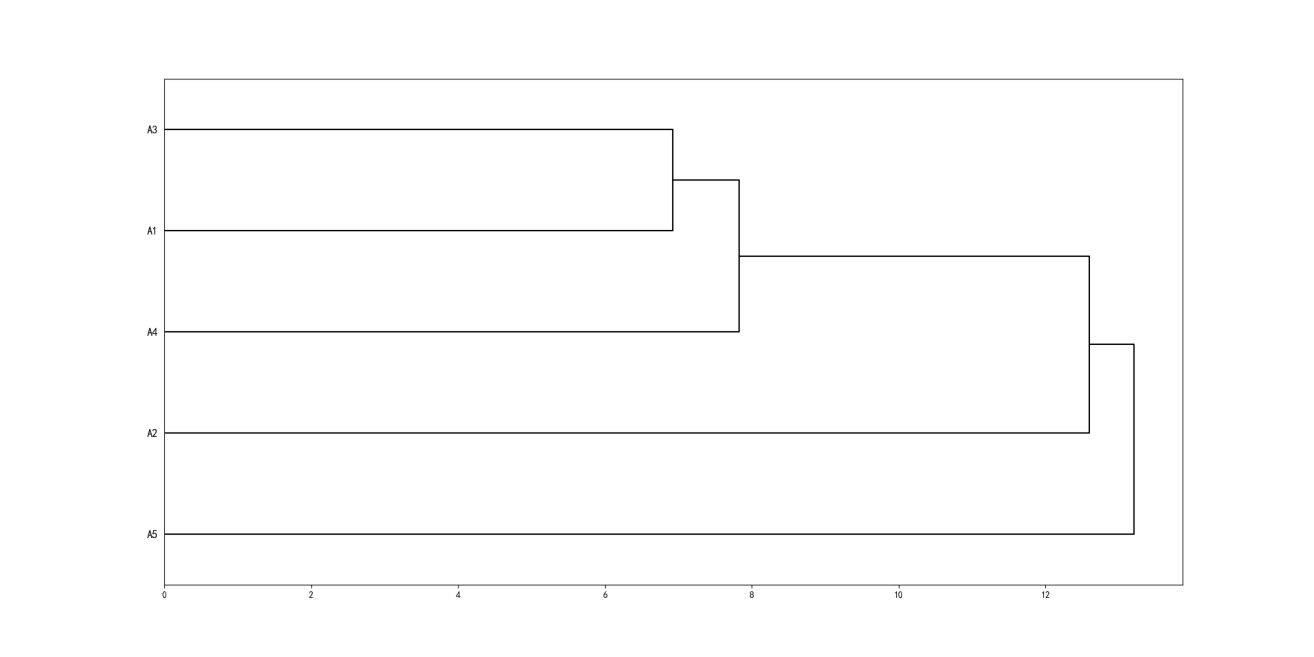
Genealogy is a tool for graphically representing clustering relationships between data samples. It displays the similarities and differences between data samples and presents them in a tree like structure. The root node of the lineage graph represents the initial clustering of all samples, while the leaf node represents a single sample. By observing the branches and connections of the lineage graph, we can determine the similarities and differences between clusters. For hierarchical clustering analysis, it is an unsupervised learning method used for hierarchical clustering of data samples. It constructs a clustering tree by calculating the distance or similarity between samples. Specifically, hierarchical clustering analysis can be divided into two types: cohesive and splitting.
Cohesive hierarchical clustering starts with each sample as an independent cluster, and gradually merges the most similar clusters until forming a large cluster. Splitting hierarchical clustering starts with all samples being treated as a large cluster, and then gradually splits into smaller clusters until each sample becomes an independent cluster.
Hierarchical clustering analysis is usually used to explore potential patterns and structures in data and generate visual lineage diagrams to represent clustering relationships. Pedigree diagrams can help us understand the similarities and differences between data samples, and determine the number and structure of clusters. It has applications in multiple fields, such as biology, social sciences, and market research.
In this analysis, we used hierarchical clustering analysis to obtain a lineage diagram that displays the clustering relationships between data samples. The lineage diagram provides a detailed explanation of the similarities and differences between clusters. By observing the structure of the lineage diagram, we can determine the partition points between clusters, thereby determining the final number and structure of clusters.
关注微信公众号发送【示例数据】获取SPSSMAX练习示例数据。
