Multiple Y-Axis
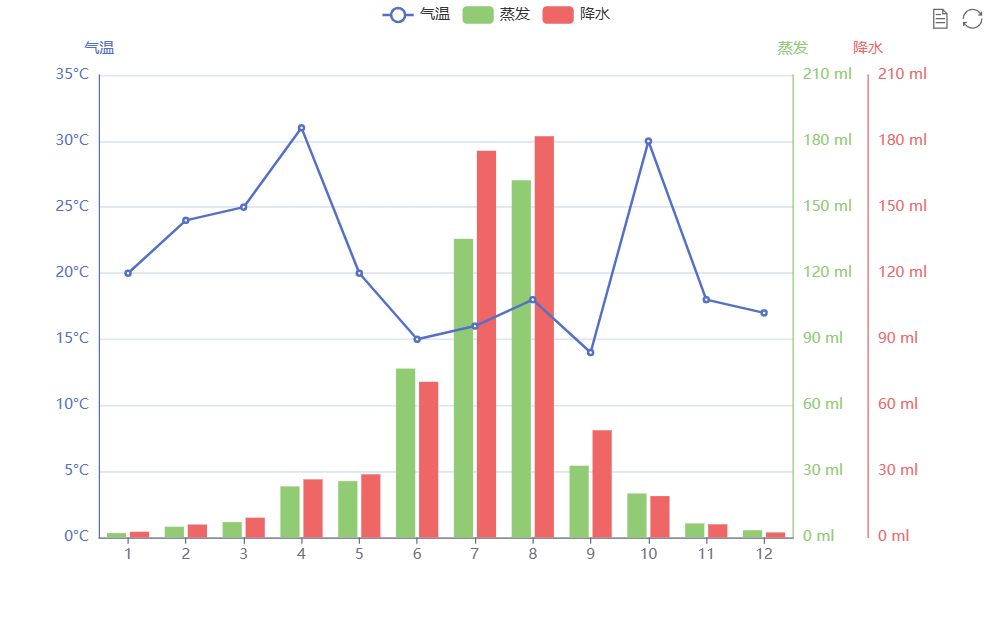
A multi Y-axis chart is a chart that displays the trends of multiple Y-axis variables on the same chart. Each Y-axis variable usually has its own scale and label, allowing us to intuitively compare their relationships. Multiple Y-axis graphs can help us observe the correlations, trends, and patterns between different variables, and provide more comprehensive data analysis.
Data description:
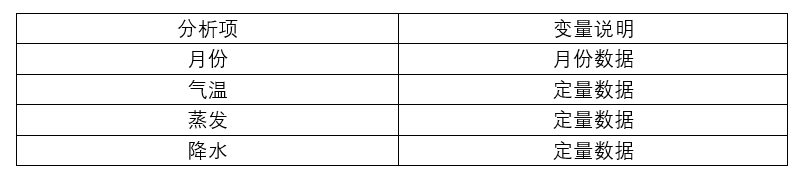
Background description:
Multi Y axis background explanation refers to the background explanation of charts using multiple Y axes to help readers better understand and interpret the data in the chart. When there are multiple Y-axes in a chart, each Y-axis typically represents different measures or indicators, such as different units or magnitudes.
The analysis results are as follows:
关注微信公众号发送【示例数据】获取SPSSMAX练习示例数据。
