Partial Correlation Analysis
Partial correlation analysis is used to calculate the correlation between two variables under the influence of controlling for other variables. It can identify and quantify the direct relationship between two variables, eliminating interference from other variables on their relationship.
In correlation analysis, correlation coefficients are usually used to analyze or measure the degree of linear correlation between these variables. However, simple correlation coefficients are often influenced by other factors and reflect non essential connections. To accurately reflect the internal relationship between two economic variables, it is necessary to calculate the partial correlation coefficient. By comparing the partial correlation coefficient with the correlation coefficient, it is more realistic and reliable to determine the intrinsic linear relationship between these two variables.
Data description:
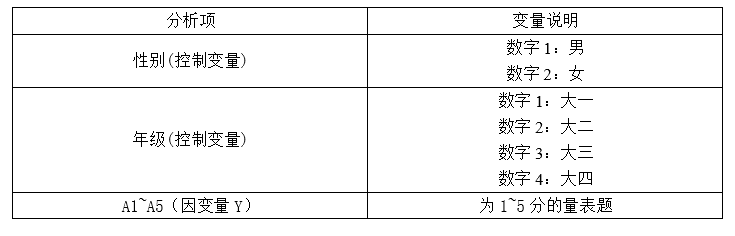
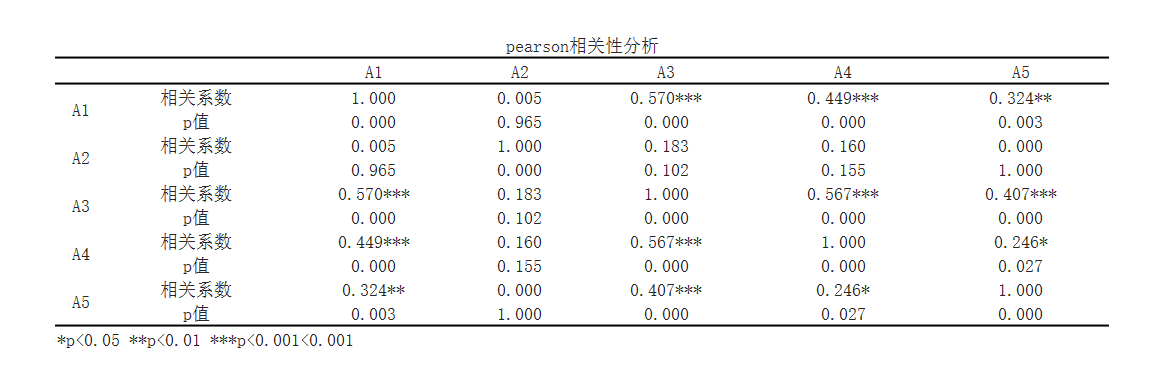
The results show that the correlation analysis results are first presented without adding control variables:
The results after adding control variables show:

According to partial correlation analysis, under the control of variables ['gender 'and' grade '], partial correlation analysis was performed on variables ['A1','A2 ','A3','A4 ','A5']. The correlation coefficient between A1 and A2 is -0.014, with a p-value of 0.899, indicating that there is no correlation. The correlation coefficient between A1 and A3 is 0.562, with a p-value of 0.0, indicating a moderate degree of correlation. The correlation coefficient between A1 and A4 is 0.45, with a p-value of 0.0, indicating that there is no correlation. The correlation coefficient between A1 and A5 is 0.318, with a p-value of 0.004, indicating that there is no correlation. The correlation coefficient between A2 and A3 is 0.167, with a p-value of 0.14, indicating that there is no correlation. The correlation coefficient between A2 and A4 is 0.157, with a p-value of 0.164, indicating that there is no correlation. The correlation coefficient between A2 and A5 is -0.01, with a p-value of 0.933, indicating that there is no correlation. The correlation coefficient between A3 and A4 is 0.569, with a p-value of 0.0, indicating a moderate degree of correlation. The correlation coefficient between A3 and A5 is 0.402, with a p-value of 0.0, indicating that there is no correlation. The correlation coefficient between A4 and A5 is 0.245, with a p-value of 0.028, indicating that there is no correlation.
Reference:
[1]严丽坤.相关系数与偏相关系数在相关分析中的应用[J].云南财贸学院学报,2003,19(3):78-80
[2]焦文玲,邹涛,巩晓峰,沈鑫.燃气日负荷影响因素的相关分析和偏相关分析[J].煤气与热力,2010,30(5):1-5
[3]陈心广,余松林,陈立功.偏相关系数和偏回归系数的统计解析与意义[J].中国卫生统计,1996,13(6):12-14
[4]王海燕,杨方廷,刘鲁.标准化系数与偏相关系数的比较与应用[J].数量经济技术经济研究,2006,23(9):150-155
[5]谢艳群,李念平,陈淑琴,孙凤梅,倪吉,周慧.长沙市居住建筑能耗调查及偏相关分析[J].煤气与热力,2007,27(5):85-88
关注微信公众号发送【示例数据】获取SPSSMAX练习示例数据。
