Time Series Analysis (ARIMA)
Time series analysis is a statistical method used to predict and interpret time series data. The ARIMA (Autoregressive Moving Average) model is a commonly used time series analysis model that combines the characteristics of autoregressive and moving average to capture trends and seasonality in data.
Data description:

Background description:
ARIMA model is a commonly used time series analysis method for predicting and simulating time series data. Its full name is the Autoregressive Integrated Moving Average model, which combines the autoregressive model (AR) and moving average model (MA), as well as differential processing of the original data (I).
The purpose of ARIMA model validation is to verify whether the model is suitable for modeling and predicting given time series data. Based on the given data and model, ARIMA model validation can evaluate the fitting degree and predictive performance of the model. Usually, we focus on the information criteria of the model (such as AIC and BIC) to determine the optimal model selection, and also pay attention to the goodness of fit (R2) of the model to evaluate its predictive ability.
The analysis results are as follows:
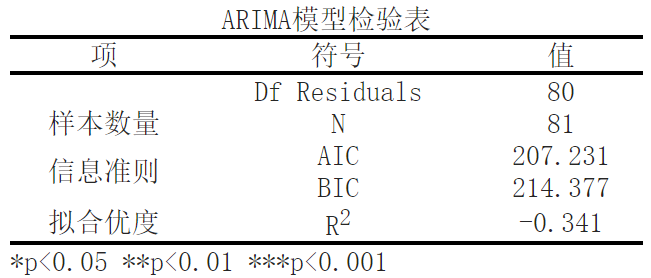
In this ARIMA model validation table, we can see several indicators and parameters. The following is a detailed explanation of each indicator:
Df Residuals: This is the degree of freedom of the residual, representing the number of independent observations remaining in the model. In this example, the degree of freedom of the residual is 80.
Sample size N: This is the total number of observations used, which is the number of samples in the dataset. In this example, the sample size is 81.
Akaike's Information Criterion (AIC): AIC is a model selection criterion used to compare the degree of fit of different models to data. The smaller the AIC value, the better the fitting of the model. In this example, the value of AIC is 207.231.
Bayesian Information Criterion (BIC): BIC is also a model selection criterion, similar to AIC, used to evaluate the degree of fit of a model. The smaller the BIC value, the better the fitting of the model. In this example, the value of BIC is 214.377.
Goodness of fit R2: R2 is an indicator that measures the degree of fit of a model to observed data, with values ranging from negative infinity to 1. The closer R2 is to 1, the better the fit of the model. However, in this example, R2 is -0.341, indicating a poor fit of the model to the data.
Overall, ARIMA model validation is an important step in modeling and predicting time series data. By evaluating the information criteria and goodness of fit of the model, we can determine the optimal model selection and understand the degree of fit and predictive performance of the model. This helps us to conduct more accurate analysis and prediction of time series data.
关注微信公众号发送【示例数据】获取SPSSMAX练习示例数据。
